Code
import pandas as pd
import numpy as np
import matplotlib.pyplot as plt
import seaborn as sns
from sklearn.metrics import confusion_matrix, ConfusionMatrixDisplayimport pandas as pd
import numpy as np
import matplotlib.pyplot as plt
import seaborn as sns
from sklearn.metrics import confusion_matrix, ConfusionMatrixDisplay### Exploring the dataset.
# Import data and show first 5 rows
df = pd.read_csv("/Users/ShirleyLi/Documents/ANLY501/Lab/m4/Lab4.2/lab4-2-data.csv")
df.head(5)| Unnamed: 0 | X1 | age | gender | height | weight | steps | hear_rate | calories | distance | entropy_heart | entropy_setps | resting_heart | corr_heart_steps | norm_heart | intensity_karvonen | sd_norm_heart | steps_times_distance | device | activity | |
|---|---|---|---|---|---|---|---|---|---|---|---|---|---|---|---|---|---|---|---|---|
| 0 | 1 | 1 | 20 | 1 | 168.0 | 65.4 | 10.771429 | 78.531302 | 0.344533 | 0.008327 | 6.221612 | 6.116349 | 59.0 | 1.000000 | 19.531302 | 0.138520 | 1.000000 | 0.089692 | apple watch | Lying |
| 1 | 2 | 2 | 20 | 1 | 168.0 | 65.4 | 11.475325 | 78.453390 | 3.287625 | 0.008896 | 6.221612 | 6.116349 | 59.0 | 1.000000 | 19.453390 | 0.137967 | 1.000000 | 0.102088 | apple watch | Lying |
| 2 | 3 | 3 | 20 | 1 | 168.0 | 65.4 | 12.179221 | 78.540825 | 9.484000 | 0.009466 | 6.221612 | 6.116349 | 59.0 | 1.000000 | 19.540825 | 0.138587 | 1.000000 | 0.115287 | apple watch | Lying |
| 3 | 4 | 4 | 20 | 1 | 168.0 | 65.4 | 12.883117 | 78.628260 | 10.154556 | 0.010035 | 6.221612 | 6.116349 | 59.0 | 1.000000 | 19.628260 | 0.139208 | 1.000000 | 0.129286 | apple watch | Lying |
| 4 | 5 | 5 | 20 | 1 | 168.0 | 65.4 | 13.587013 | 78.715695 | 10.825111 | 0.010605 | 6.221612 | 6.116349 | 59.0 | 0.982816 | 19.715695 | 0.139828 | 0.241567 | 0.144088 | apple watch | Lying |
# Reomonve Unnamed: 0 and X1 columns, convert device to dummy variable, and drop device column.
df = df.drop(columns=['Unnamed: 0', 'X1'])
device_cat = pd.get_dummies(df, columns=['device'])
df = df.drop(columns=['device'])
df| age | gender | height | weight | steps | hear_rate | calories | distance | entropy_heart | entropy_setps | resting_heart | corr_heart_steps | norm_heart | intensity_karvonen | sd_norm_heart | steps_times_distance | activity | |
|---|---|---|---|---|---|---|---|---|---|---|---|---|---|---|---|---|---|
| 0 | 20 | 1 | 168.0 | 65.4 | 10.771429 | 78.531302 | 0.344533 | 0.008327 | 6.221612 | 6.116349 | 59.0 | 1.000000 | 19.531302 | 0.138520 | 1.000000 | 0.089692 | Lying |
| 1 | 20 | 1 | 168.0 | 65.4 | 11.475325 | 78.453390 | 3.287625 | 0.008896 | 6.221612 | 6.116349 | 59.0 | 1.000000 | 19.453390 | 0.137967 | 1.000000 | 0.102088 | Lying |
| 2 | 20 | 1 | 168.0 | 65.4 | 12.179221 | 78.540825 | 9.484000 | 0.009466 | 6.221612 | 6.116349 | 59.0 | 1.000000 | 19.540825 | 0.138587 | 1.000000 | 0.115287 | Lying |
| 3 | 20 | 1 | 168.0 | 65.4 | 12.883117 | 78.628260 | 10.154556 | 0.010035 | 6.221612 | 6.116349 | 59.0 | 1.000000 | 19.628260 | 0.139208 | 1.000000 | 0.129286 | Lying |
| 4 | 20 | 1 | 168.0 | 65.4 | 13.587013 | 78.715695 | 10.825111 | 0.010605 | 6.221612 | 6.116349 | 59.0 | 0.982816 | 19.715695 | 0.139828 | 0.241567 | 0.144088 | Lying |
| ... | ... | ... | ... | ... | ... | ... | ... | ... | ... | ... | ... | ... | ... | ... | ... | ... | ... |
| 6259 | 46 | 0 | 157.5 | 71.4 | 1.000000 | 35.000000 | 20.500000 | 1.000000 | 0.000000 | 0.000000 | 35.0 | 1.000000 | 0.000000 | 0.000000 | 0.000000 | 1.000000 | Running 7 METs |
| 6260 | 46 | 0 | 157.5 | 71.4 | 1.000000 | 35.000000 | 20.500000 | 1.000000 | 0.000000 | 0.000000 | 35.0 | 1.000000 | 0.000000 | 0.000000 | 1.000000 | 1.000000 | Running 7 METs |
| 6261 | 46 | 0 | 157.5 | 71.4 | 1.000000 | 35.000000 | 20.500000 | 1.000000 | 0.000000 | 0.000000 | 35.0 | 1.000000 | 0.000000 | 0.000000 | 1.000000 | 1.000000 | Running 7 METs |
| 6262 | 46 | 0 | 157.5 | 71.4 | 1.000000 | 35.000000 | 20.500000 | 1.000000 | 0.000000 | 0.000000 | 35.0 | 1.000000 | 0.000000 | 0.000000 | 1.000000 | 1.000000 | Running 7 METs |
| 6263 | 46 | 0 | 157.5 | 71.4 | 1.000000 | 35.000000 | 20.500000 | 1.000000 | 0.000000 | 0.000000 | 35.0 | 1.000000 | 0.000000 | 0.000000 | 1.000000 | 1.000000 | Running 7 METs |
6264 rows × 17 columns
### Split the dataset into training and testing sets
# Split the dataframe into X and y and then split X and y into train and test sets.
from sklearn.model_selection import train_test_split

y = df.activity
x = df.drop(columns=['activity'])

X_train, X_test, Y_train, Y_test = train_test_split(x, y, test_size=0.2, random_state=0)# Show the shape of the train and test sets, and levels of the depencent variable (Y)
print(X_train.shape)
print(X_test.shape)
print(Y_train.shape)
print(Y_test.shape)
level_y = y.value_counts()
print(level_y)(5011, 16)
(1253, 16)
(5011,)
(1253,)
Lying 1379
Running 7 METs 1114
Running 5 METs 1002
Running 3 METs 950
Sitting 930
Self Pace walk 889
Name: activity, dtype: int64### SVM with Linear kernels
# Import svc from sklearn.svm and classsification_report, confusion_matrix from sklearn.metrics.
# Fit the classfier on the training data and predict on the test data. Set the classifier to be linear and C between 0.35-0.75.
from sklearn.svm import SVC
from sklearn import svm
from sklearn.metrics import classification_report, confusion_matrix

model = svm.LinearSVC(C = 0.55)
model = model.fit(X_train, Y_train)
YP_train = model.predict(X_train)
YP_test = model.predict(X_test)

plt.rcParams['figure.figsize']=10,10
def confusion_plot(y_data,y_pred):
    cm = confusion_matrix(y_data, y_pred)
    disp = ConfusionMatrixDisplay(confusion_matrix=cm)
    disp.plot()
    return plt.show()

confusion_plot(Y_train,YP_train)
/Users/ShirleyLi/opt/anaconda3/lib/python3.9/site-packages/sklearn/svm/_base.py:1206: ConvergenceWarning:
Liblinear failed to converge, increase the number of iterations.

# Calculate the confusion matrix and classification report for the train and test data.
from sklearn.metrics import classification_report
target_names = ['Lying', 'Running 7 METs', 'Running 5 METs', 'Running 3 METs', 'Sitting', 'Self Pace walk']
train_rep = classification_report(Y_train, YP_train, target_names=target_names)
test_rep = classification_report(Y_test, YP_test, target_names=target_names)
print(train_rep)
print(test_rep)
precision recall f1-score support
Lying 0.34 0.36 0.35 1096
Running 7 METs 0.00 0.00 0.00 783
Running 5 METs 0.20 0.58 0.30 809
Running 3 METs 0.50 0.34 0.40 868
Sitting 0.18 0.06 0.09 703
Self Pace walk 0.22 0.20 0.21 752
accuracy 0.27 5011
macro avg 0.24 0.26 0.23 5011
weighted avg 0.25 0.27 0.24 5011
precision recall f1-score support
Lying 0.31 0.32 0.32 283
Running 7 METs 0.00 0.00 0.00 167
Running 5 METs 0.19 0.59 0.29 193
Running 3 METs 0.57 0.35 0.43 246
Sitting 0.20 0.05 0.08 186
Self Pace walk 0.19 0.18 0.18 178
accuracy 0.26 1253
macro avg 0.24 0.25 0.22 1253
weighted avg 0.27 0.26 0.24 1253
# Save the results in a data frame.
with open('train_rep.csv', 'w') as out:
    out.write(train_rep)
with open('test_rep.csv', 'w') as out:
    out.write(test_rep)

train_rep = pd.read_csv('train_rep.csv')
test_rep = pd.read_csv('test_rep.csv')

train_rep = pd.DataFrame(train_rep)
test_rep = pd.DataFrame(test_rep)# display the results data frame
print(train_rep)
print(test_rep) precision recall f1-score support
0 Lying 0.34 0.36 0.35 ...
1 Running 7 METs 0.00 0.00 0.00 ...
2 Running 5 METs 0.20 0.58 0.30 ...
3 Running 3 METs 0.50 0.34 0.40 ...
4 Sitting 0.18 0.06 0.09 ...
5 Self Pace walk 0.22 0.20 0.21 ...
6 accuracy 0.27 ...
7 macro avg 0.24 0.26 0.23 ...
8 weighted avg 0.25 0.27 0.24 ...
precision recall f1-score support
0 Lying 0.31 0.32 0.32 ...
1 Running 7 METs 0.00 0.00 0.00 ...
2 Running 5 METs 0.19 0.59 0.29 ...
3 Running 3 METs 0.57 0.35 0.43 ...
4 Sitting 0.20 0.05 0.08 ...
5 Self Pace walk 0.19 0.18 0.18 ...
6 accuracy 0.26 ...
7 macro avg 0.24 0.25 0.22 ...
8 weighted avg 0.27 0.26 0.24 ... # Display Confusion Matrix for the test data. Remember to use the ConfusionMatrixDisplay function.
confusion_plot(Y_test,YP_test)
## SVM with Polynomial kernels
# Import svc from sklearn.svm and classsification_report, confusion_matrix from sklearn.metrics.
# Fit the classfier on the training data and predict on the test data. Set the classifier to be polynomial, C between 0.35-0.75, and degree = 2.
model = svm.SVC(C = 0.55, kernel = 'poly',degree = 2)
model = model.fit(X_train, Y_train)
YP_train = model.predict(X_train)
YP_test = model.predict(X_test)# Calculate the confusion matrix and classification report for the train and test data.
train_rep = classification_report(Y_train, YP_train, target_names=target_names)
test_rep = classification_report(Y_test, YP_test, target_names=target_names)
print(train_rep)
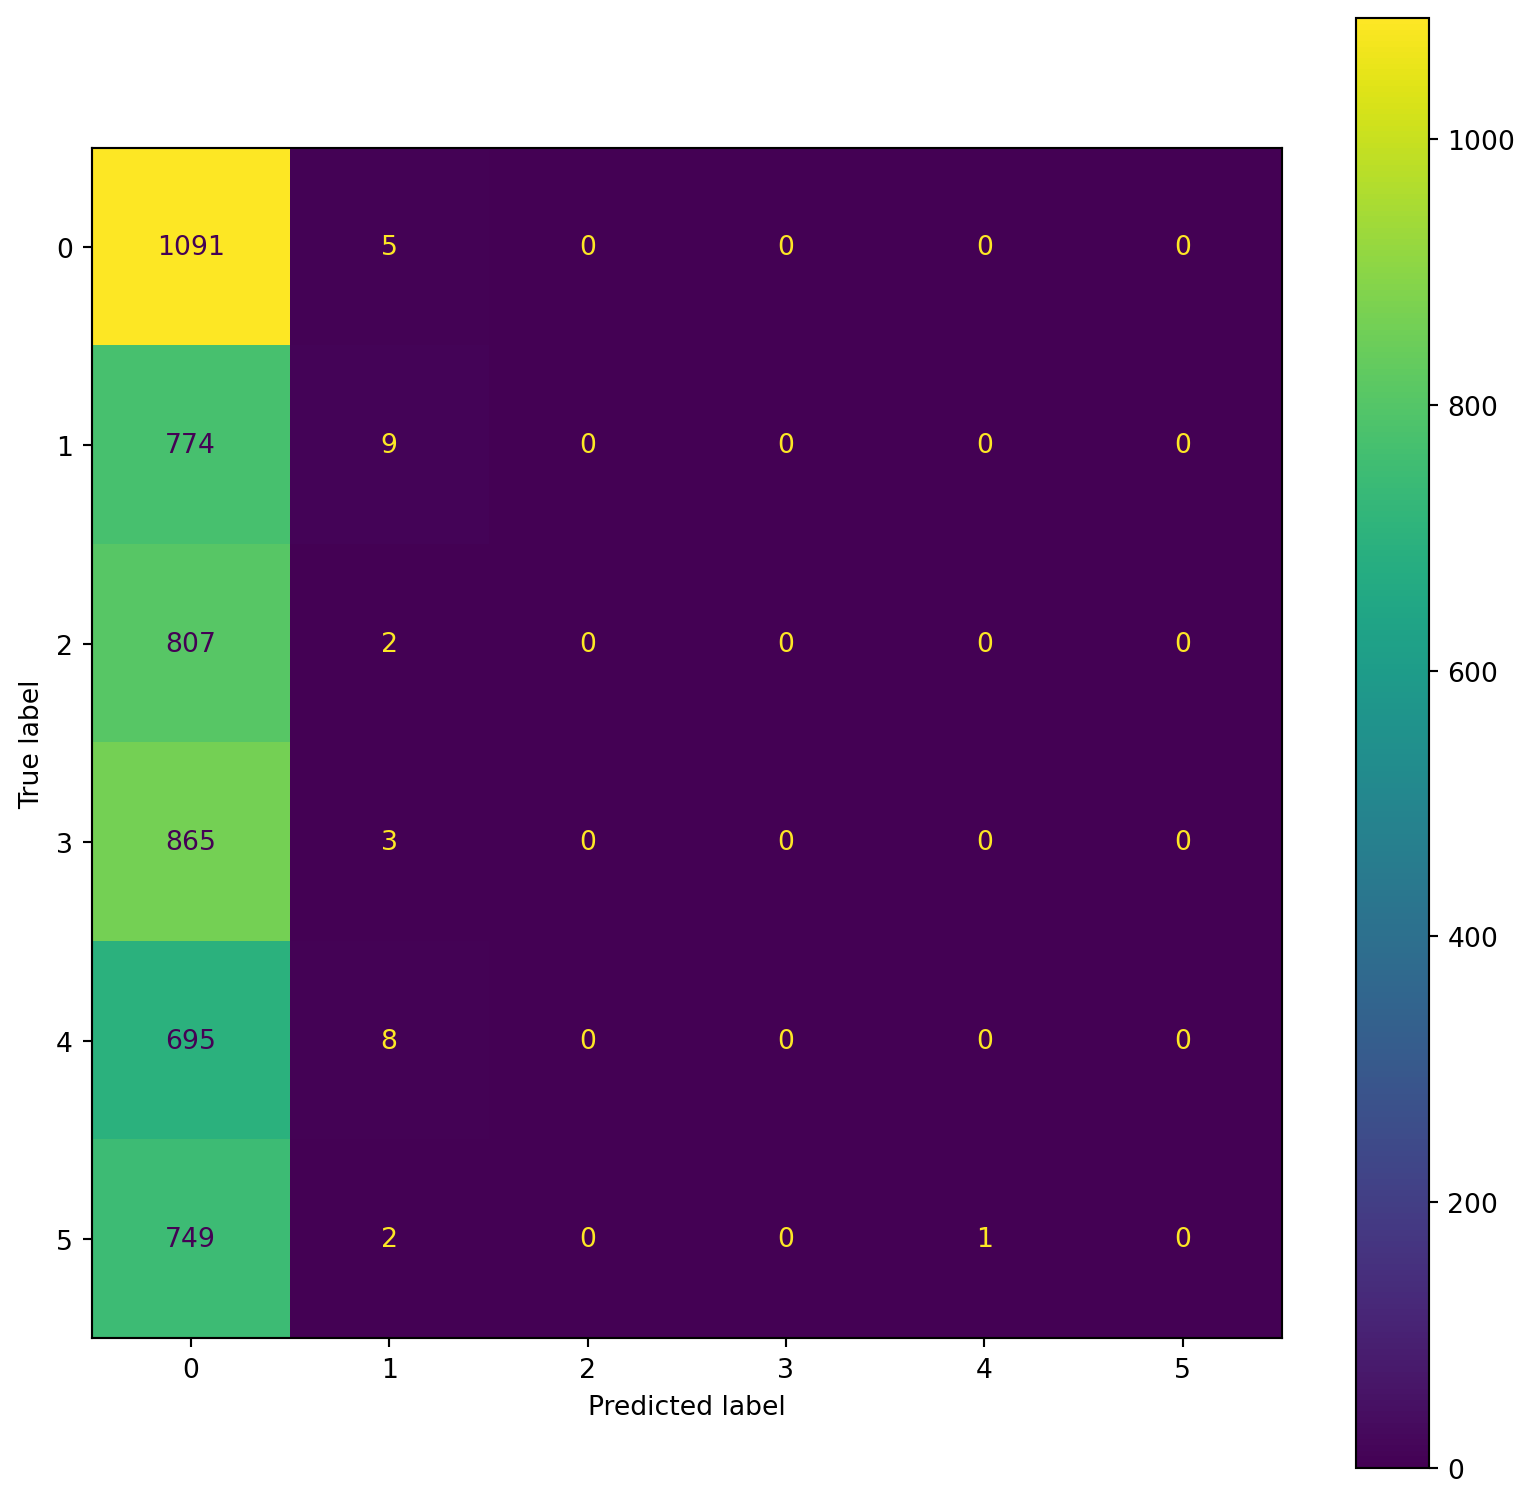
confusion_plot(Y_train,YP_train)
print(test_rep)
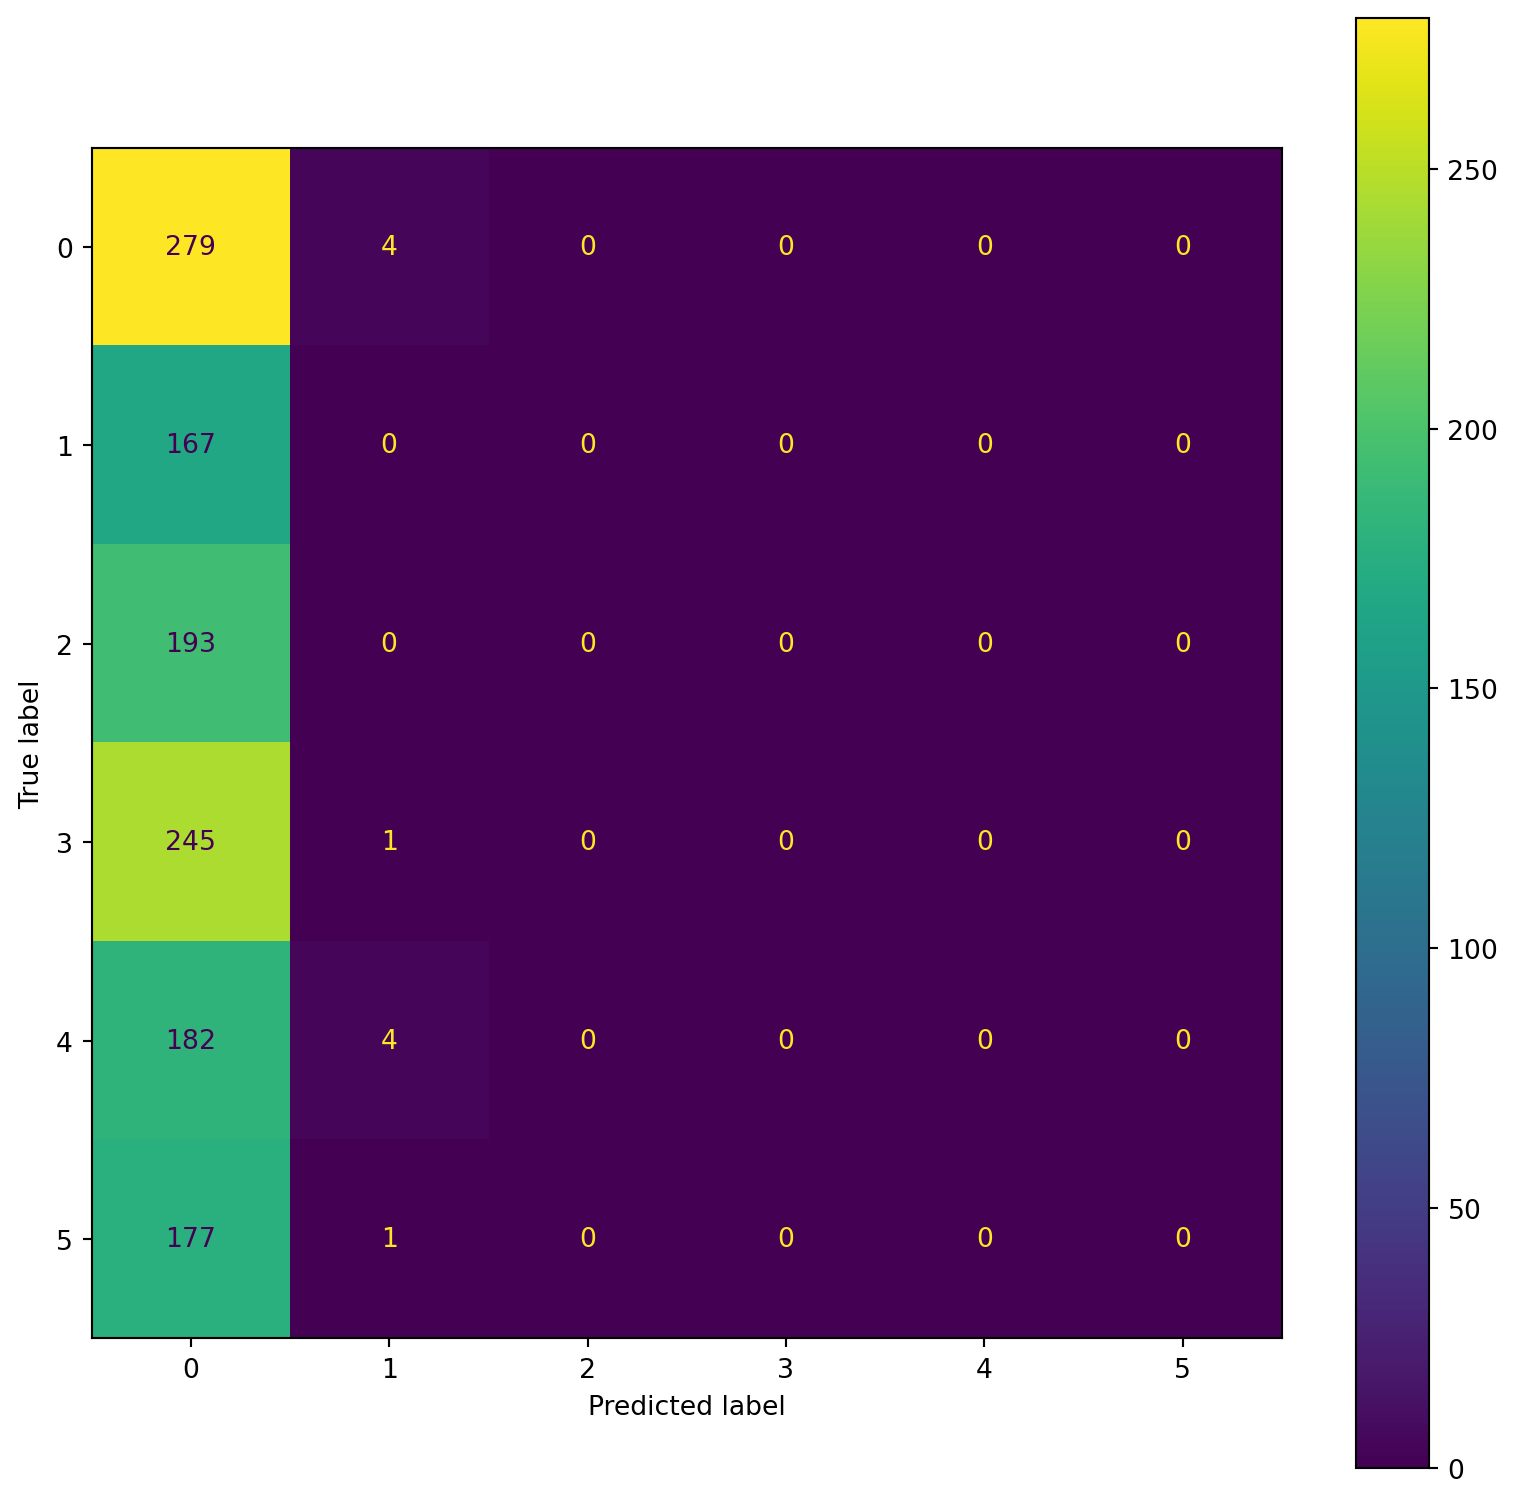
confusion_plot(Y_test,YP_test)/Users/ShirleyLi/opt/anaconda3/lib/python3.9/site-packages/sklearn/metrics/_classification.py:1318: UndefinedMetricWarning:
Precision and F-score are ill-defined and being set to 0.0 in labels with no predicted samples. Use `zero_division` parameter to control this behavior.
/Users/ShirleyLi/opt/anaconda3/lib/python3.9/site-packages/sklearn/metrics/_classification.py:1318: UndefinedMetricWarning:
Precision and F-score are ill-defined and being set to 0.0 in labels with no predicted samples. Use `zero_division` parameter to control this behavior.
/Users/ShirleyLi/opt/anaconda3/lib/python3.9/site-packages/sklearn/metrics/_classification.py:1318: UndefinedMetricWarning:
Precision and F-score are ill-defined and being set to 0.0 in labels with no predicted samples. Use `zero_division` parameter to control this behavior.
/Users/ShirleyLi/opt/anaconda3/lib/python3.9/site-packages/sklearn/metrics/_classification.py:1318: UndefinedMetricWarning:
Precision and F-score are ill-defined and being set to 0.0 in labels with no predicted samples. Use `zero_division` parameter to control this behavior.
/Users/ShirleyLi/opt/anaconda3/lib/python3.9/site-packages/sklearn/metrics/_classification.py:1318: UndefinedMetricWarning:
Precision and F-score are ill-defined and being set to 0.0 in labels with no predicted samples. Use `zero_division` parameter to control this behavior.
/Users/ShirleyLi/opt/anaconda3/lib/python3.9/site-packages/sklearn/metrics/_classification.py:1318: UndefinedMetricWarning:
Precision and F-score are ill-defined and being set to 0.0 in labels with no predicted samples. Use `zero_division` parameter to control this behavior.
                precision    recall  f1-score   support

         Lying       0.22      1.00      0.36      1096
Running 7 METs       0.31      0.01      0.02       783
Running 5 METs       0.00      0.00      0.00       809
Running 3 METs       0.00      0.00      0.00       868
       Sitting       0.00      0.00      0.00       703
Self Pace walk       0.00      0.00      0.00       752

      accuracy                           0.22      5011
     macro avg       0.09      0.17      0.06      5011
  weighted avg       0.10      0.22      0.08      5011

                precision    recall  f1-score   support

         Lying       0.22      0.99      0.37       283
Running 7 METs       0.00      0.00      0.00       167
Running 5 METs       0.00      0.00      0.00       193
Running 3 METs       0.00      0.00      0.00       246
       Sitting       0.00      0.00      0.00       186
Self Pace walk       0.00      0.00      0.00       178

      accuracy                           0.22      1253
     macro avg       0.04      0.16      0.06      1253
  weighted avg       0.05      0.22      0.08      1253

# Save the results in a data frame.
with open('train_rep2.csv', 'w') as out:
    out.write(train_rep)
with open('test_rep2.csv', 'w') as out:
    out.write(test_rep)

train_rep = pd.read_csv('train_rep2.csv')
test_rep = pd.read_csv('test_rep2.csv')

train_rep = pd.DataFrame(train_rep)
test_rep = pd.DataFrame(test_rep)# display the results data frame
print(train_rep)
print(test_rep) precision recall f1-score support
0 Lying 0.22 1.00 0.36 ...
1 Running 7 METs 0.31 0.01 0.02 ...
2 Running 5 METs 0.00 0.00 0.00 ...
3 Running 3 METs 0.00 0.00 0.00 ...
4 Sitting 0.00 0.00 0.00 ...
5 Self Pace walk 0.00 0.00 0.00 ...
6 accuracy 0.22 ...
7 macro avg 0.09 0.17 0.06 ...
8 weighted avg 0.10 0.22 0.08 ...
precision recall f1-score support
0 Lying 0.22 0.99 0.37 ...
1 Running 7 METs 0.00 0.00 0.00 ...
2 Running 5 METs 0.00 0.00 0.00 ...
3 Running 3 METs 0.00 0.00 0.00 ...
4 Sitting 0.00 0.00 0.00 ...
5 Self Pace walk 0.00 0.00 0.00 ...
6 accuracy 0.22 ...
7 macro avg 0.04 0.16 0.06 ...
8 weighted avg 0.05 0.22 0.08 ... # Display Confusion Matrix for the test data. Remember to use the ConfusionMatrixDisplay function.
confusion_plot(Y_test,YP_test)
## SVM with RBF kernels
# Import svc from sklearn.svm and classsification_report, confusion_matrix from sklearn.metrics.
# Fit the classfier on the training data and predict on the test data. Set the classifier to be linear and C between 0.35-0.75.
model = svm.SVC(C = 0.55, kernel = 'rbf')
model = model.fit(X_train, Y_train)
YP_train = model.predict(X_train)
YP_test = model.predict(X_test)# Calculate the confusion matrix and classification report for the train and test data.
train_rep = classification_report(Y_train, YP_train, target_names=target_names)
test_rep = classification_report(Y_test, YP_test, target_names=target_names)
print(train_rep)
confusion_plot(Y_train,YP_train)
print(test_rep)
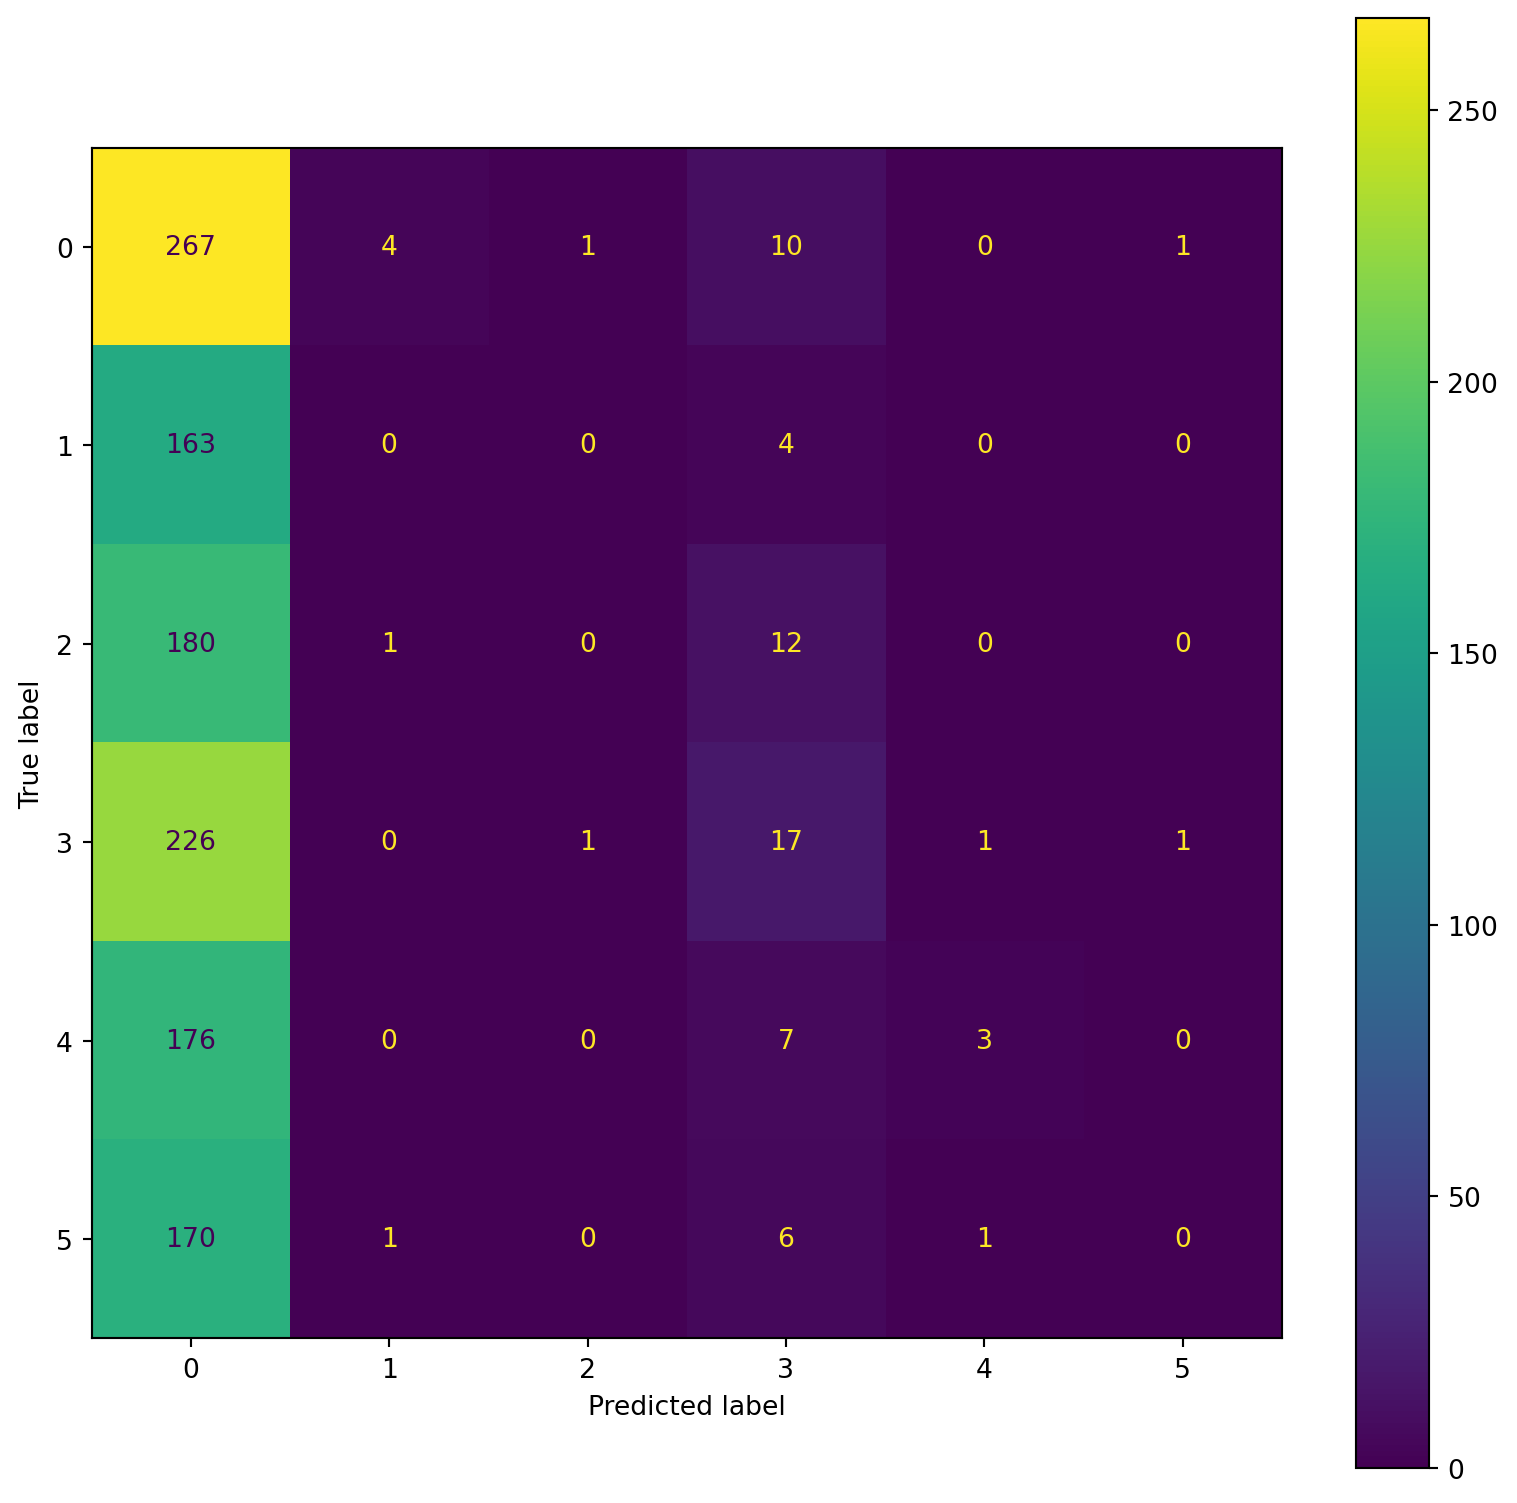
confusion_plot(Y_test,YP_test) precision recall f1-score support
Lying 0.22 0.97 0.36 1096
Running 7 METs 0.55 0.01 0.02 783
Running 5 METs 0.67 0.00 0.00 809
Running 3 METs 0.30 0.08 0.12 868
Sitting 0.47 0.01 0.02 703
Self Pace walk 0.17 0.00 0.01 752
accuracy 0.23 5011
macro avg 0.40 0.18 0.09 5011
weighted avg 0.39 0.23 0.11 5011

                precision    recall  f1-score   support

         Lying       0.23      0.94      0.36       283
Running 7 METs       0.00      0.00      0.00       167
Running 5 METs       0.00      0.00      0.00       193
Running 3 METs       0.30      0.07      0.11       246
       Sitting       0.60      0.02      0.03       186
Self Pace walk       0.00      0.00      0.00       178

      accuracy                           0.23      1253
     macro avg       0.19      0.17      0.08      1253
  weighted avg       0.20      0.23      0.11      1253

# Save the results in a data frame.
with open('train_rep3.csv', 'w') as out:
    out.write(train_rep)
with open('test_rep3.csv', 'w') as out:
    out.write(test_rep)

train_rep = pd.read_csv('train_rep3.csv')
test_rep = pd.read_csv('test_rep3.csv')

train_rep = pd.DataFrame(train_rep)
test_rep = pd.DataFrame(test_rep)# display the results data frame
print(train_rep)
print(test_rep) precision recall f1-score support
0 Lying 0.22 0.97 0.36 ...
1 Running 7 METs 0.55 0.01 0.02 ...
2 Running 5 METs 0.67 0.00 0.00 ...
3 Running 3 METs 0.30 0.08 0.12 ...
4 Sitting 0.47 0.01 0.02 ...
5 Self Pace walk 0.17 0.00 0.01 ...
6 accuracy 0.23 ...
7 macro avg 0.40 0.18 0.09 ...
8 weighted avg 0.39 0.23 0.11 ...
precision recall f1-score support
0 Lying 0.23 0.94 0.36 ...
1 Running 7 METs 0.00 0.00 0.00 ...
2 Running 5 METs 0.00 0.00 0.00 ...
3 Running 3 METs 0.30 0.07 0.11 ...
4 Sitting 0.60 0.02 0.03 ...
5 Self Pace walk 0.00 0.00 0.00 ...
6 accuracy 0.23 ...
7 macro avg 0.19 0.17 0.08 ...
8 weighted avg 0.20 0.23 0.11 ... # Display Confusion Matrix for the test data. Remember to use the ConfusionMatrixDisplay function.
confusion_plot(Y_test,YP_test)
## SVM with Sigmoid kernels
# Import svc from sklearn.svm and classsification_report, confusion_matrix from sklearn.metrics.
# Fit the classfier on the training data and predict on the test data. Set the classifier to be linear and C between 0.35-0.75.
model = svm.SVC(C = 0.55, kernel = 'sigmoid',degree = 2)
model = model.fit(X_train, Y_train)
YP_train = model.predict(X_train)
YP_test = model.predict(X_test)# Calculate the confusion matrix and classification report for the train and test data.
train_rep = classification_report(Y_train, YP_train, target_names=target_names)
test_rep = classification_report(Y_test, YP_test, target_names=target_names)
print(train_rep)
confusion_plot(Y_train,YP_train)
print(test_rep)
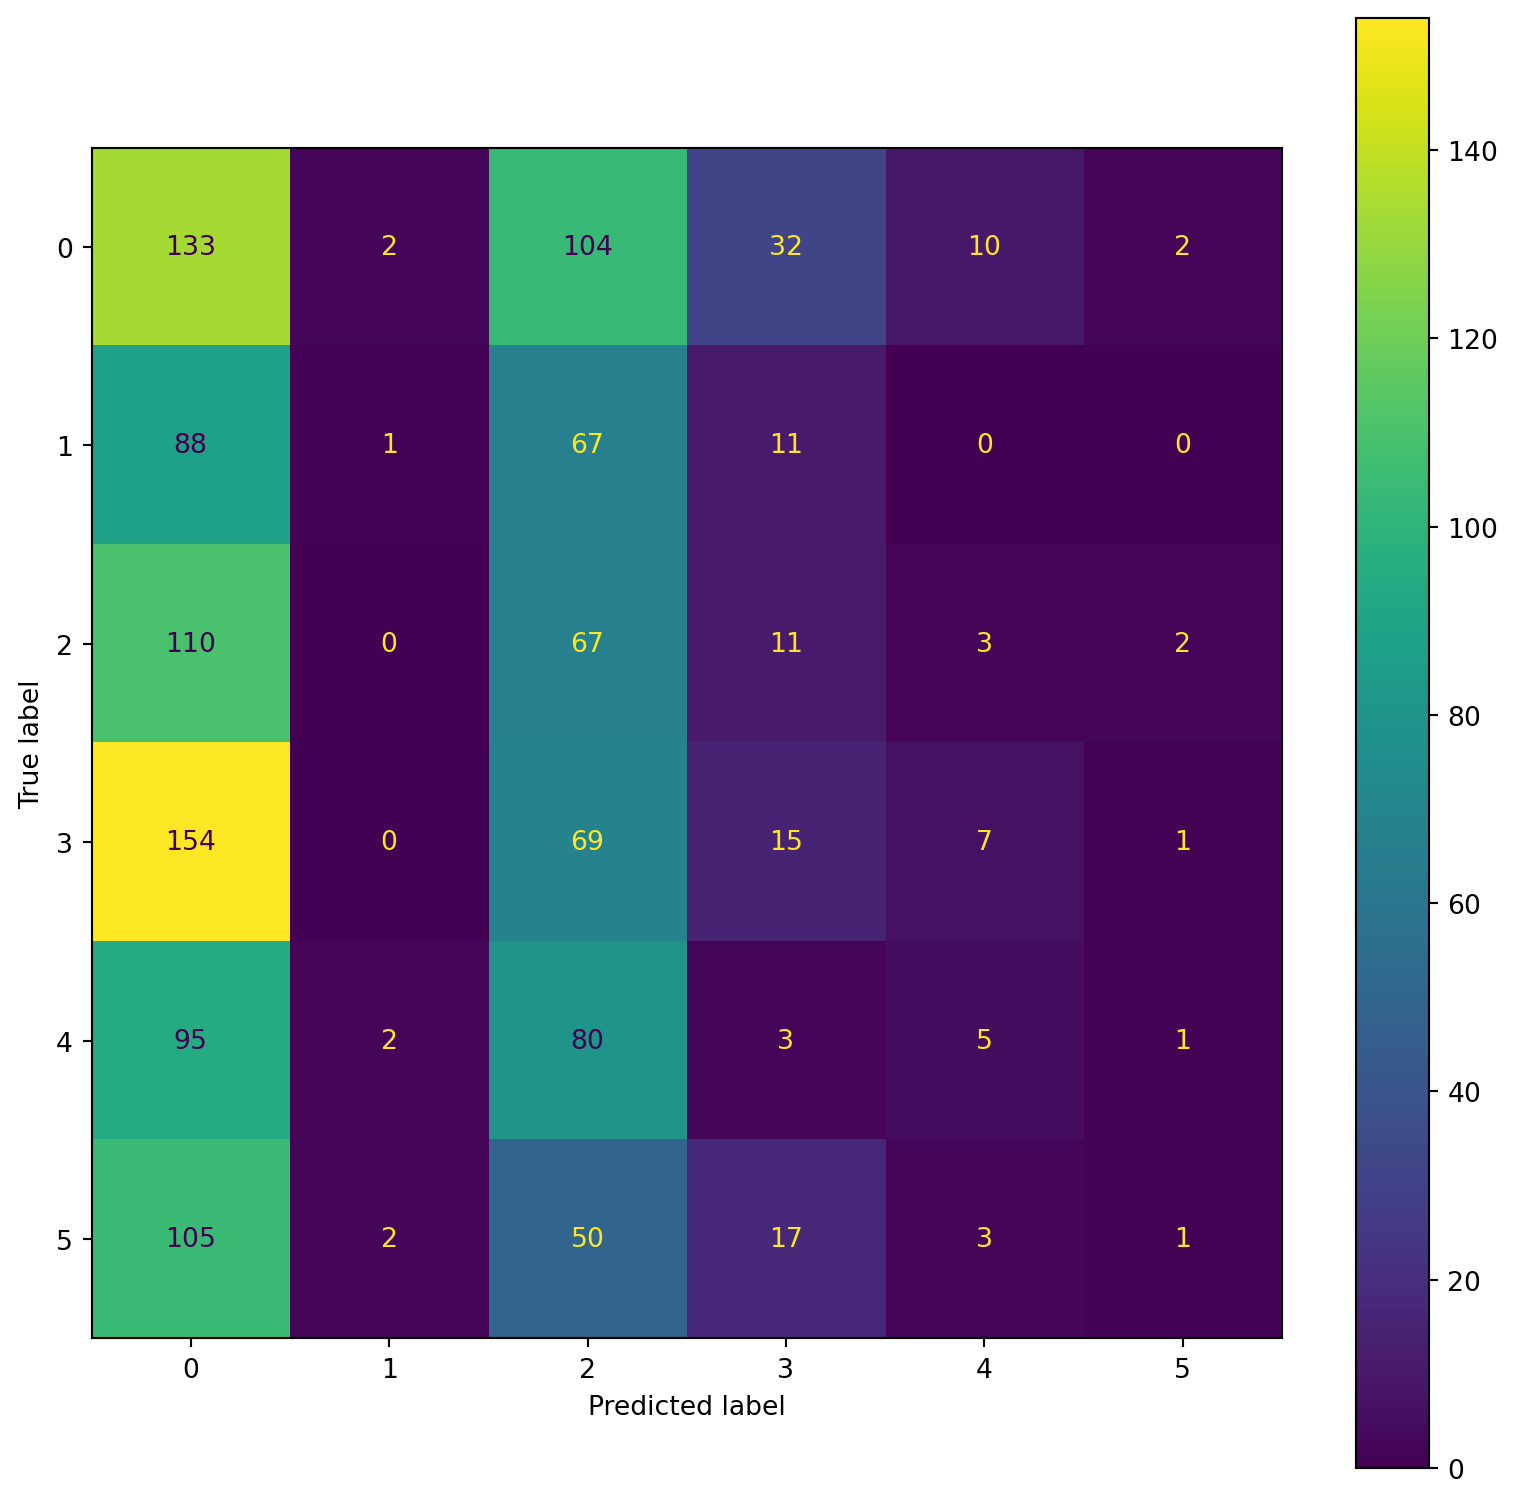
confusion_plot(Y_test,YP_test) precision recall f1-score support
Lying 0.21 0.54 0.30 1096
Running 7 METs 0.15 0.01 0.01 783
Running 5 METs 0.18 0.38 0.25 809
Running 3 METs 0.19 0.08 0.11 868
Sitting 0.18 0.02 0.04 703
Self Pace walk 0.05 0.00 0.00 752
accuracy 0.20 5011
macro avg 0.16 0.17 0.12 5011
weighted avg 0.17 0.20 0.13 5011

                precision    recall  f1-score   support

         Lying       0.19      0.47      0.27       283
Running 7 METs       0.14      0.01      0.01       167
Running 5 METs       0.15      0.35      0.21       193
Running 3 METs       0.17      0.06      0.09       246
       Sitting       0.18      0.03      0.05       186
Self Pace walk       0.14      0.01      0.01       178

      accuracy                           0.18      1253
     macro avg       0.16      0.15      0.11      1253
  weighted avg       0.17      0.18      0.12      1253

# Save the results in a data frame.
with open('train_rep4.csv', 'w') as out:
    out.write(train_rep)
with open('test_rep4.csv', 'w') as out:
    out.write(test_rep)

train_rep = pd.read_csv('train_rep4.csv')
test_rep = pd.read_csv('test_rep4.csv')

train_rep = pd.DataFrame(train_rep)
test_rep = pd.DataFrame(test_rep)# display the results data frame
print(train_rep)
print(test_rep) precision recall f1-score support
0 Lying 0.21 0.54 0.30 ...
1 Running 7 METs 0.15 0.01 0.01 ...
2 Running 5 METs 0.18 0.38 0.25 ...
3 Running 3 METs 0.19 0.08 0.11 ...
4 Sitting 0.18 0.02 0.04 ...
5 Self Pace walk 0.05 0.00 0.00 ...
6 accuracy 0.20 ...
7 macro avg 0.16 0.17 0.12 ...
8 weighted avg 0.17 0.20 0.13 ...
precision recall f1-score support
0 Lying 0.19 0.47 0.27 ...
1 Running 7 METs 0.14 0.01 0.01 ...
2 Running 5 METs 0.15 0.35 0.21 ...
3 Running 3 METs 0.17 0.06 0.09 ...
4 Sitting 0.18 0.03 0.05 ...
5 Self Pace walk 0.14 0.01 0.01 ...
6 accuracy 0.18 ...
7 macro avg 0.16 0.15 0.11 ...
8 weighted avg 0.17 0.18 0.12 ... # Display Confusion Matrix for the test data. Remember to use the ConfusionMatrixDisplay function.
confusion_plot(Y_test,YP_test)