Code
# ## Name: Zixuan Li
# ## Date: 10/20/2022
# ## Class Section: 4
# ## Lab Section: 5# ## Name: Zixuan Li
# ## Date: 10/20/2022
# ## Class Section: 4
# ## Lab Section: 5import pandas as pd
import seaborn as sns
import matplotlib.pyplot as plt
from sklearn import tree
from IPython.display import Image
import numpy as np
from sklearn.metrics import accuracy_score
from sklearn.metrics import precision_score
from sklearn.metrics import recall_score# LOAD THE DATAFRAME
from sklearn.datasets import load_breast_cancer
(x,y) = load_breast_cancer(return_X_y=True,as_frame=True)
df=pd.concat([x,y],axis=1)
# LOOK AT FIRST ROW
print(df.iloc[0])mean radius 17.990000
mean texture 10.380000
mean perimeter 122.800000
mean area 1001.000000
mean smoothness 0.118400
mean compactness 0.277600
mean concavity 0.300100
mean concave points 0.147100
mean symmetry 0.241900
mean fractal dimension 0.078710
radius error 1.095000
texture error 0.905300
perimeter error 8.589000
area error 153.400000
smoothness error 0.006399
compactness error 0.049040
concavity error 0.053730
concave points error 0.015870
symmetry error 0.030030
fractal dimension error 0.006193
worst radius 25.380000
worst texture 17.330000
worst perimeter 184.600000
worst area 2019.000000
worst smoothness 0.162200
worst compactness 0.665600
worst concavity 0.711900
worst concave points 0.265400
worst symmetry 0.460100
worst fractal dimension 0.118900
target 0.000000
Name: 0, dtype: float64print(df.keys())Index(['mean radius', 'mean texture', 'mean perimeter', 'mean area',
'mean smoothness', 'mean compactness', 'mean concavity',
'mean concave points', 'mean symmetry', 'mean fractal dimension',
'radius error', 'texture error', 'perimeter error', 'area error',
'smoothness error', 'compactness error', 'concavity error',
'concave points error', 'symmetry error', 'fractal dimension error',
'worst radius', 'worst texture', 'worst perimeter', 'worst area',
'worst smoothness', 'worst compactness', 'worst concavity',
'worst concave points', 'worst symmetry', 'worst fractal dimension',
'target'],
dtype='object')df2 = pd.DataFrame()
df2['columns']= df.columns
df2['dtypes']=list(df.dtypes)
df2['min']=list(df.min())
df2['mean']=list(df.mean())
df2['max']=list(df.max())
print(df2.to_markdown(index=False))| columns | dtypes | min | mean | max |
|:------------------------|:---------|------------:|-------------:|-----------:|
| mean radius | float64 | 6.981 | 14.1273 | 28.11 |
| mean texture | float64 | 9.71 | 19.2896 | 39.28 |
| mean perimeter | float64 | 43.79 | 91.969 | 188.5 |
| mean area | float64 | 143.5 | 654.889 | 2501 |
| mean smoothness | float64 | 0.05263 | 0.0963603 | 0.1634 |
| mean compactness | float64 | 0.01938 | 0.104341 | 0.3454 |
| mean concavity | float64 | 0 | 0.0887993 | 0.4268 |
| mean concave points | float64 | 0 | 0.0489191 | 0.2012 |
| mean symmetry | float64 | 0.106 | 0.181162 | 0.304 |
| mean fractal dimension | float64 | 0.04996 | 0.0627976 | 0.09744 |
| radius error | float64 | 0.1115 | 0.405172 | 2.873 |
| texture error | float64 | 0.3602 | 1.21685 | 4.885 |
| perimeter error | float64 | 0.757 | 2.86606 | 21.98 |
| area error | float64 | 6.802 | 40.3371 | 542.2 |
| smoothness error | float64 | 0.001713 | 0.00704098 | 0.03113 |
| compactness error | float64 | 0.002252 | 0.0254781 | 0.1354 |
| concavity error | float64 | 0 | 0.0318937 | 0.396 |
| concave points error | float64 | 0 | 0.0117961 | 0.05279 |
| symmetry error | float64 | 0.007882 | 0.0205423 | 0.07895 |
| fractal dimension error | float64 | 0.0008948 | 0.0037949 | 0.02984 |
| worst radius | float64 | 7.93 | 16.2692 | 36.04 |
| worst texture | float64 | 12.02 | 25.6772 | 49.54 |
| worst perimeter | float64 | 50.41 | 107.261 | 251.2 |
| worst area | float64 | 185.2 | 880.583 | 4254 |
| worst smoothness | float64 | 0.07117 | 0.132369 | 0.2226 |
| worst compactness | float64 | 0.02729 | 0.254265 | 1.058 |
| worst concavity | float64 | 0 | 0.272188 | 1.252 |
| worst concave points | float64 | 0 | 0.114606 | 0.291 |
| worst symmetry | float64 | 0.1565 | 0.290076 | 0.6638 |
| worst fractal dimension | float64 | 0.05504 | 0.0839458 | 0.2075 |
| target | int64 | 0 | 0.627417 | 1 |sum0 = sum(df['target']==0)
sum1 = sum(df['target']==1)
sum0_1 = sum0+sum1
print('Number of points with target=0: ',sum0,sum0/(sum0_1))
print('Number of points with target=1: ',sum1,sum1/(sum0_1))Number of points with target=0: 212 0.37258347978910367
Number of points with target=1: 357 0.6274165202108963corr = df.corr(); #print(corr) #COMPUTE CORRELATION OF FEATER MATRIX
print(corr.shape)
sns.set_theme(style="white")
f, ax = plt.subplots(figsize=(20, 20)) # Set up the matplotlib figure
cmap = sns.diverging_palette(230, 20, as_cmap=True) # Generate a custom diverging colormap
# Draw the heatmap with the mask and correct aspect ratio
sns.heatmap(corr, cmap=cmap, vmin=-1, vmax=1, center=0,
square=True, linewidths=.5, cbar_kws={"shrink": .5})
plt.show();(31, 31)
# # RUN THE FOLLOWING CODE TO GENERATE A SEABORN PAIRPLOT
tmp=pd.concat([df.sample(n=10,axis=1),y],axis=1)
print(tmp.shape)
sns.pairplot(tmp,hue="target", diag_kind='kde')
plt.show()
(569, 11)
Y = df['target']
X = df.drop(columns=['target'])from sklearn.model_selection import train_test_split
x_train, x_test, y_train, y_test = train_test_split(X, Y, test_size=0.2, random_state=0)print("x_train.shape : ",x_train.shape)
print("y_train.shape : ",x_train.shape)
print("x_test.shape : ",x_test.shape)
print("y_test.shape : ",y_test.shape)x_train.shape : (455, 30)
y_train.shape : (455, 30)
x_test.shape : (114, 30)
y_test.shape : (114,)from sklearn import tree
model = tree.DecisionTreeClassifier()
model = model.fit(x_train, y_train)from sklearn.datasets import make_classification
from sklearn.svm import SVC
clf = SVC(random_state=0)
clf.fit(x_train, y_train)
yp_train = model.predict(x_train)
yp_test = model.predict(x_test)from sklearn.metrics import confusion_matrix, ConfusionMatrixDisplay
plt.rcParams['figure.figsize']=10,10
def confusion_plot(y_data,y_pred):
dt = confusion_matrix(y_data, y_pred)
disp = ConfusionMatrixDisplay(confusion_matrix=dt)
disp.plot()
return plt.show()
confusion_plot(y_test,yp_test)
a = accuracy_score(y_test, yp_test)
nr = recall_score(y_test, yp_test, labels=0)
np= precision_score(y_test, yp_test, labels=0)
pr= recall_score(y_test, yp_test, labels=1)
pp= precision_score(y_test, yp_test, labels=1)
dt = confusion_matrix(y_test, yp_test)
print("ACCURACY: ",a,
"\nNEGATIVE RECALL (Y=0): ", nr,
"\nNEGATIVE PRECISION (Y=0): " , np,
"\nPOSITIVE RECALL (Y=1): ", pr,
"\nPOSITIVE PRECISION (Y=1): ", pp,
"\n",dt)
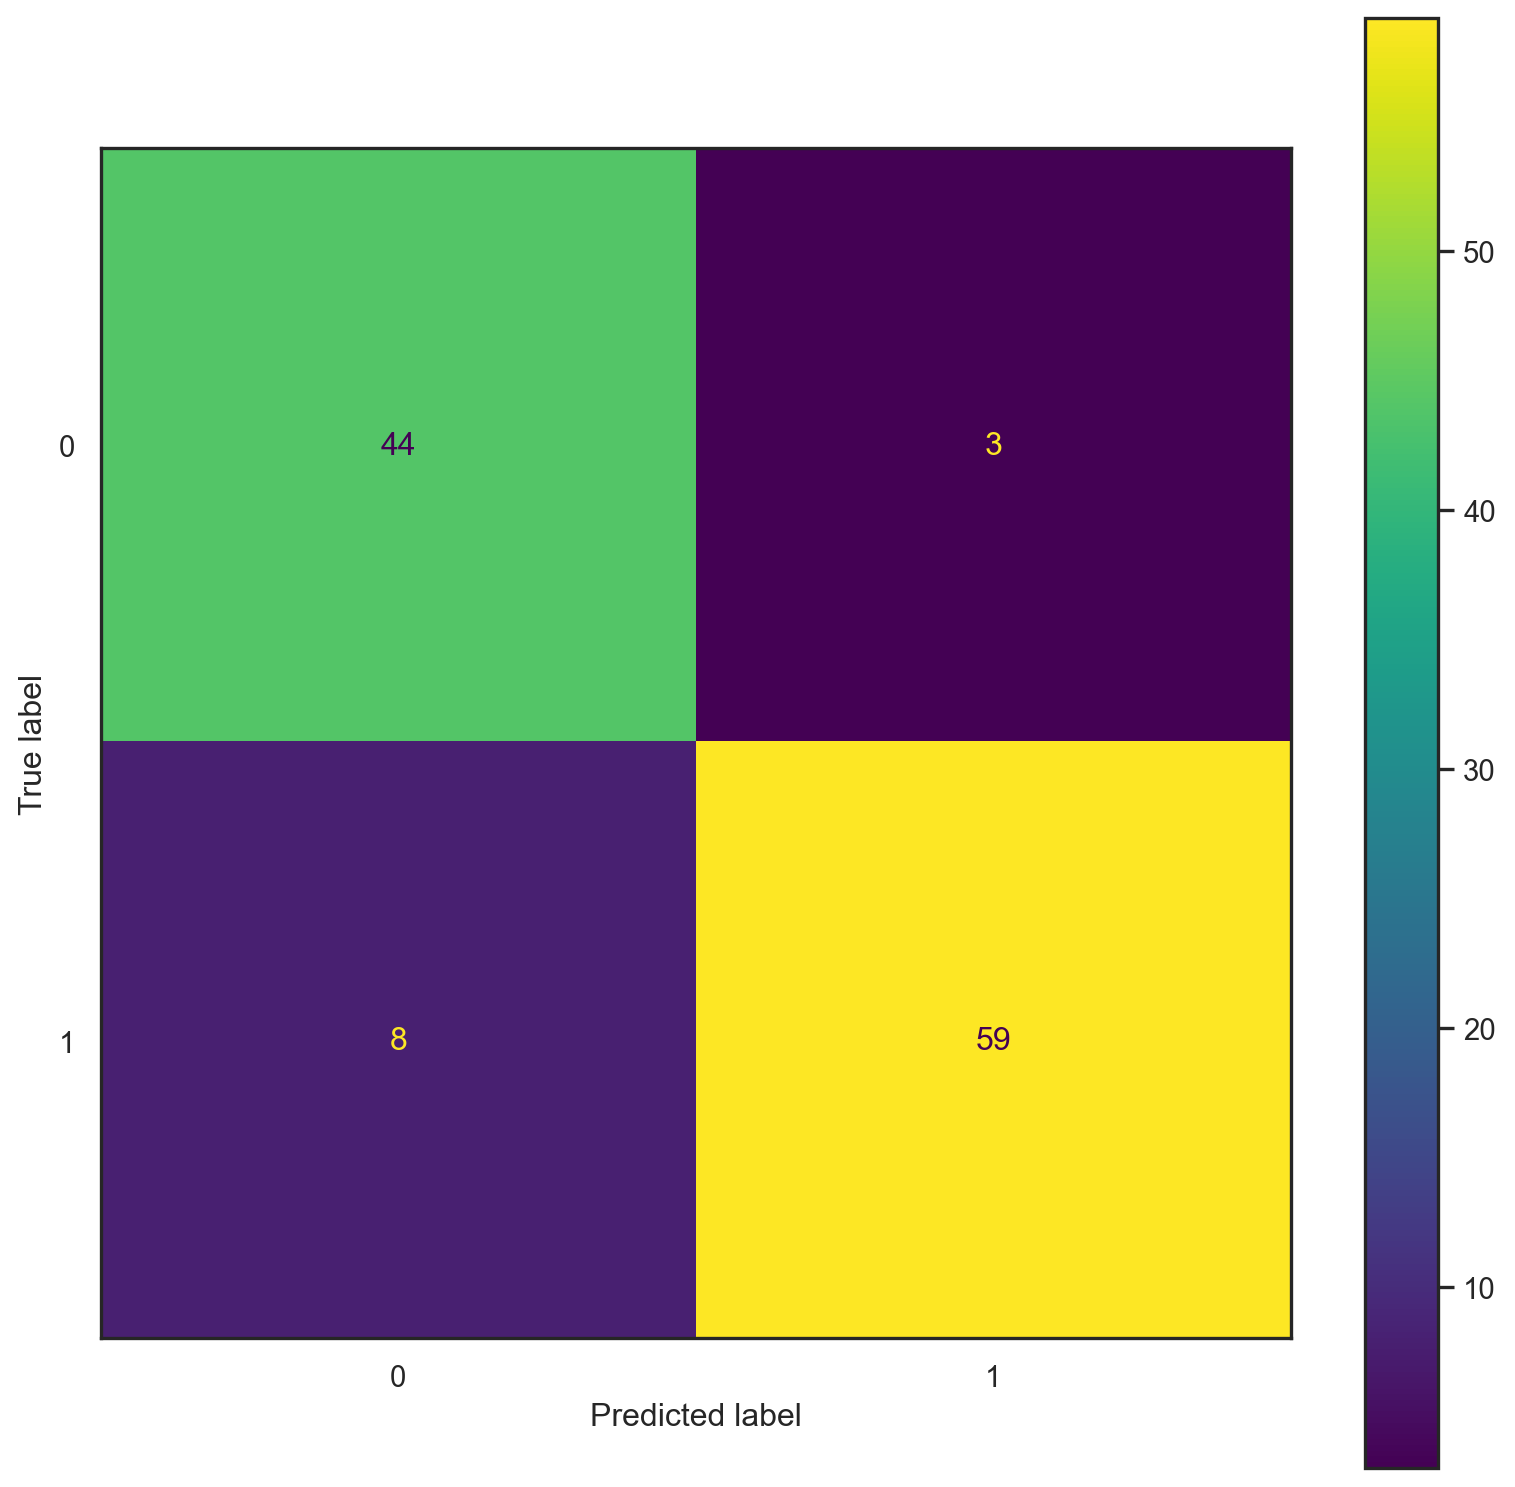
ACCURACY:  0.9035087719298246
NEGATIVE RECALL (Y=0):  0.8805970149253731
NEGATIVE PRECISION (Y=0):  0.9516129032258065
POSITIVE RECALL (Y=1):  0.8805970149253731
POSITIVE PRECISION (Y=1):  0.9516129032258065
 [[44  3]
[ 8 59]]print("------TRAINING------")
confusion_plot(y_train,yp_train)
print("------TEST------")
confusion_plot(y_test,yp_test)------TRAINING------
------TEST------
from sklearn import datasets
from sklearn.tree import DecisionTreeClassifier
def plot_tree(model,X,Y):
    feature_names = X.columns
    target_names = str(Y.unique().tolist())
    model = tree.DecisionTreeClassifier()
    clf = model.fit(X, Y)
    fig = plt.figure(figsize=(25,20))
    tree.plot_tree(clf,
                   feature_names=feature_names,
                   class_names=target_names,
                   filled=True)
return plt.show()test_results=[]
train_results=[]
for num_layer in range(1,20):
model = tree.DecisionTreeClassifier(max_depth=num_layer)
clf = model.fit(x_train, y_train)
yp_train=clf.predict(x_train)
yp_test=clf.predict(x_test)
# print(y_pred.shape)
test_results.append([num_layer,accuracy_score(y_test, yp_test),recall_score(y_test, yp_test,pos_label=0),recall_score(y_test, yp_test,pos_label=1)])
train_results.append([num_layer,accuracy_score(y_train,yp_train),recall_score(y_train, yp_train,pos_label=0),recall_score(y_train, yp_train,pos_label=1)])test_results = pd.DataFrame(test_results)
train_results = pd.DataFrame(train_results)plt.rcParams[‘figure.figsize’]=8,7 plt.plot(train_results[1], label=‘train’,marker = ‘o’) plt.plot(test_results[1], label=‘test’,marker = ‘o’) plt.xlabel(‘Number of layers in decision trees(max_depth)’,fontsize=18) plt.ylabel(‘Accuracy: training and test’,fontsize=18) plt.legend(fontsize=15) plt.show()
plt.plot(train_results[2], label=‘train’,marker = ‘o’) plt.plot(test_results[2], label=‘test’,marker = ‘o’) plt.xlabel(‘Number of layers in decision trees(max_depth)’,fontsize=18) plt.ylabel(‘Recall(y=0): training and test’,fontsize=18) plt.legend(fontsize=15) plt.show()
plt.plot(train_results[3], label=‘train’,marker = ‘o’) plt.plot(test_results[3], label=‘test’,marker = ‘o’) plt.xlabel(‘Number of layers in decision trees(max_depth)’,fontsize=18) plt.ylabel(‘Recall(y=1): training and test’,fontsize=18) plt.legend(fontsize=15) plt.show()
from sklearn import tree
model = tree.DecisionTreeClassifier(max_depth=max(train_results[0]))
model = model.fit(x_train, y_train)

yp_train=model.predict(x_train)
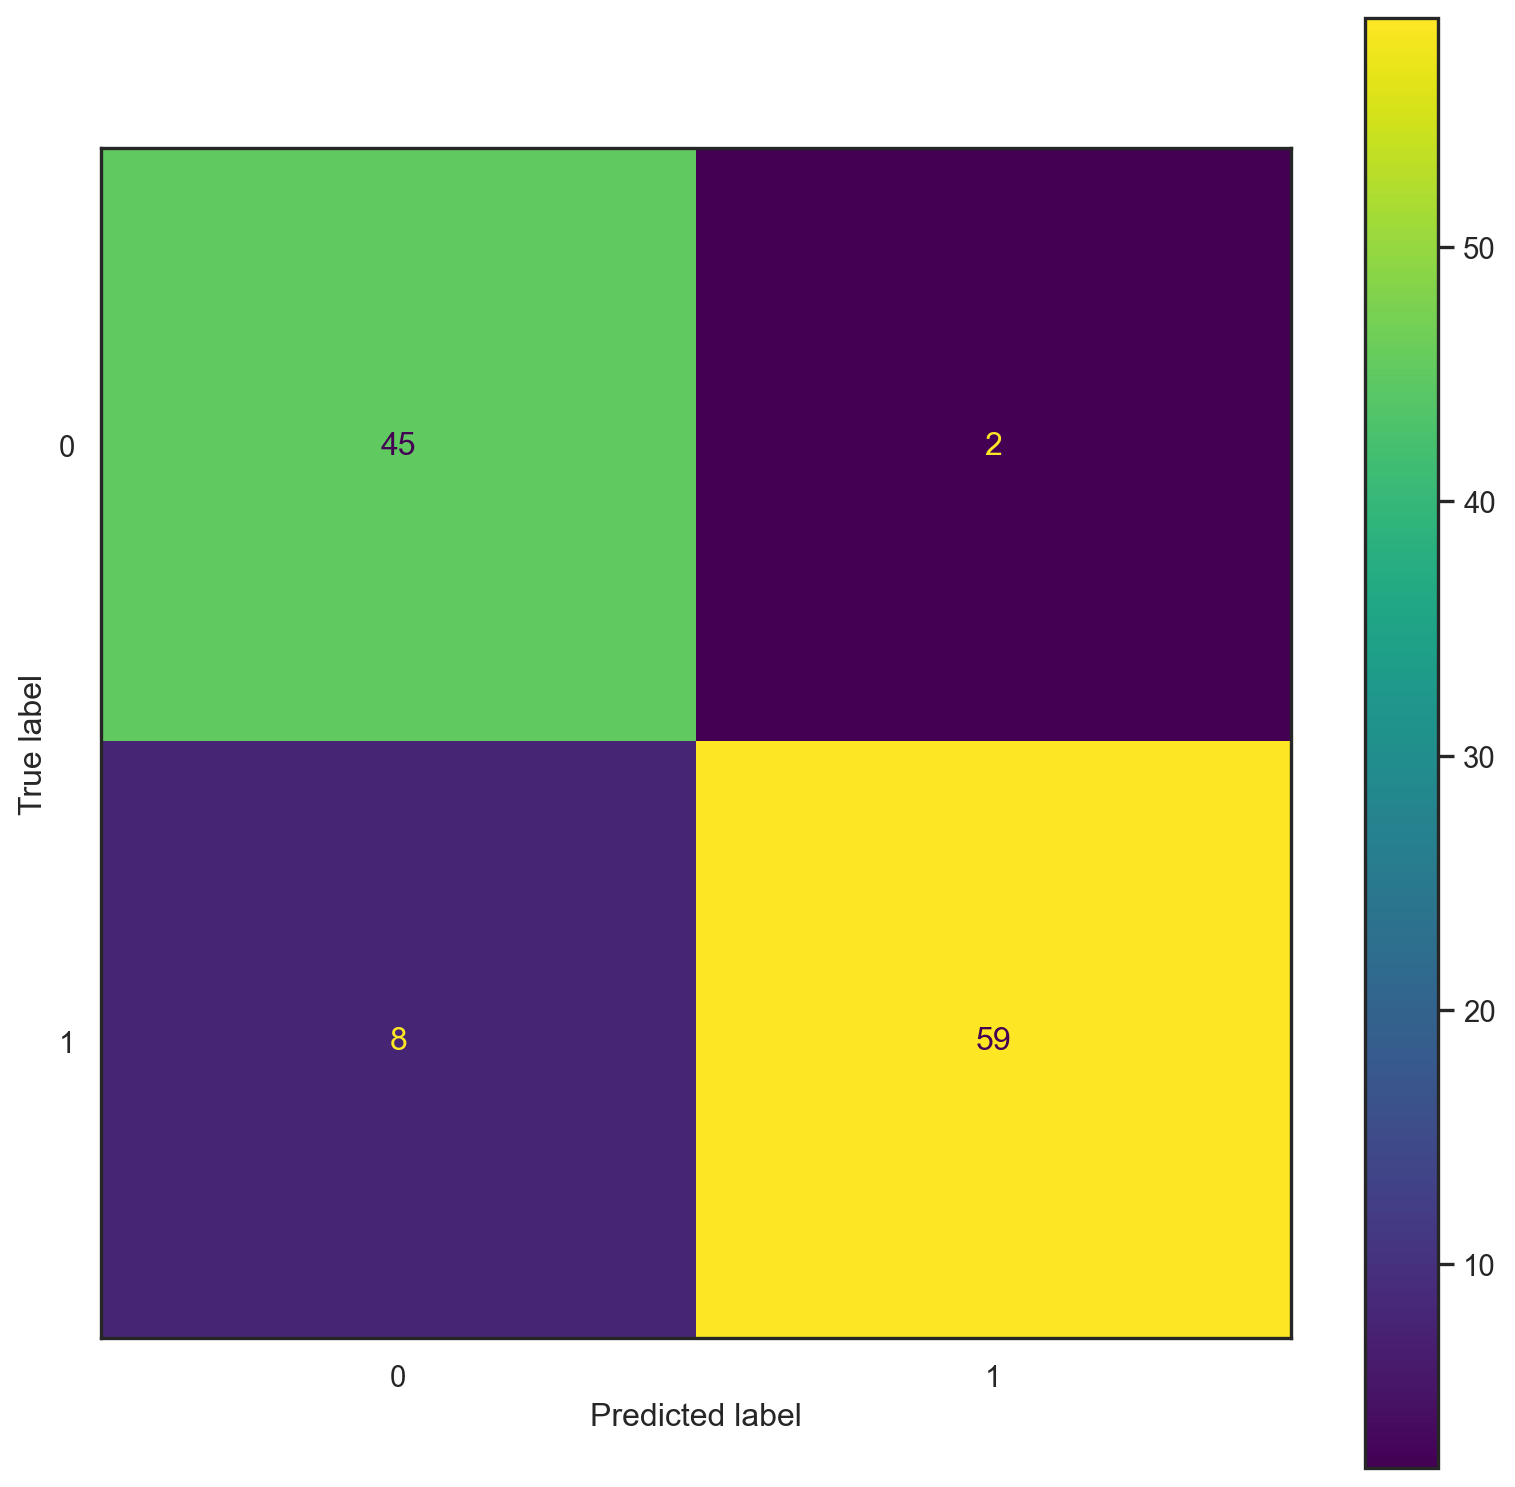
yp_test=model.predict(x_test)print("------TRAINING------")
confusion_plot(y_train,yp_train)
print("------TEST------")
confusion_plot(y_test,yp_test)
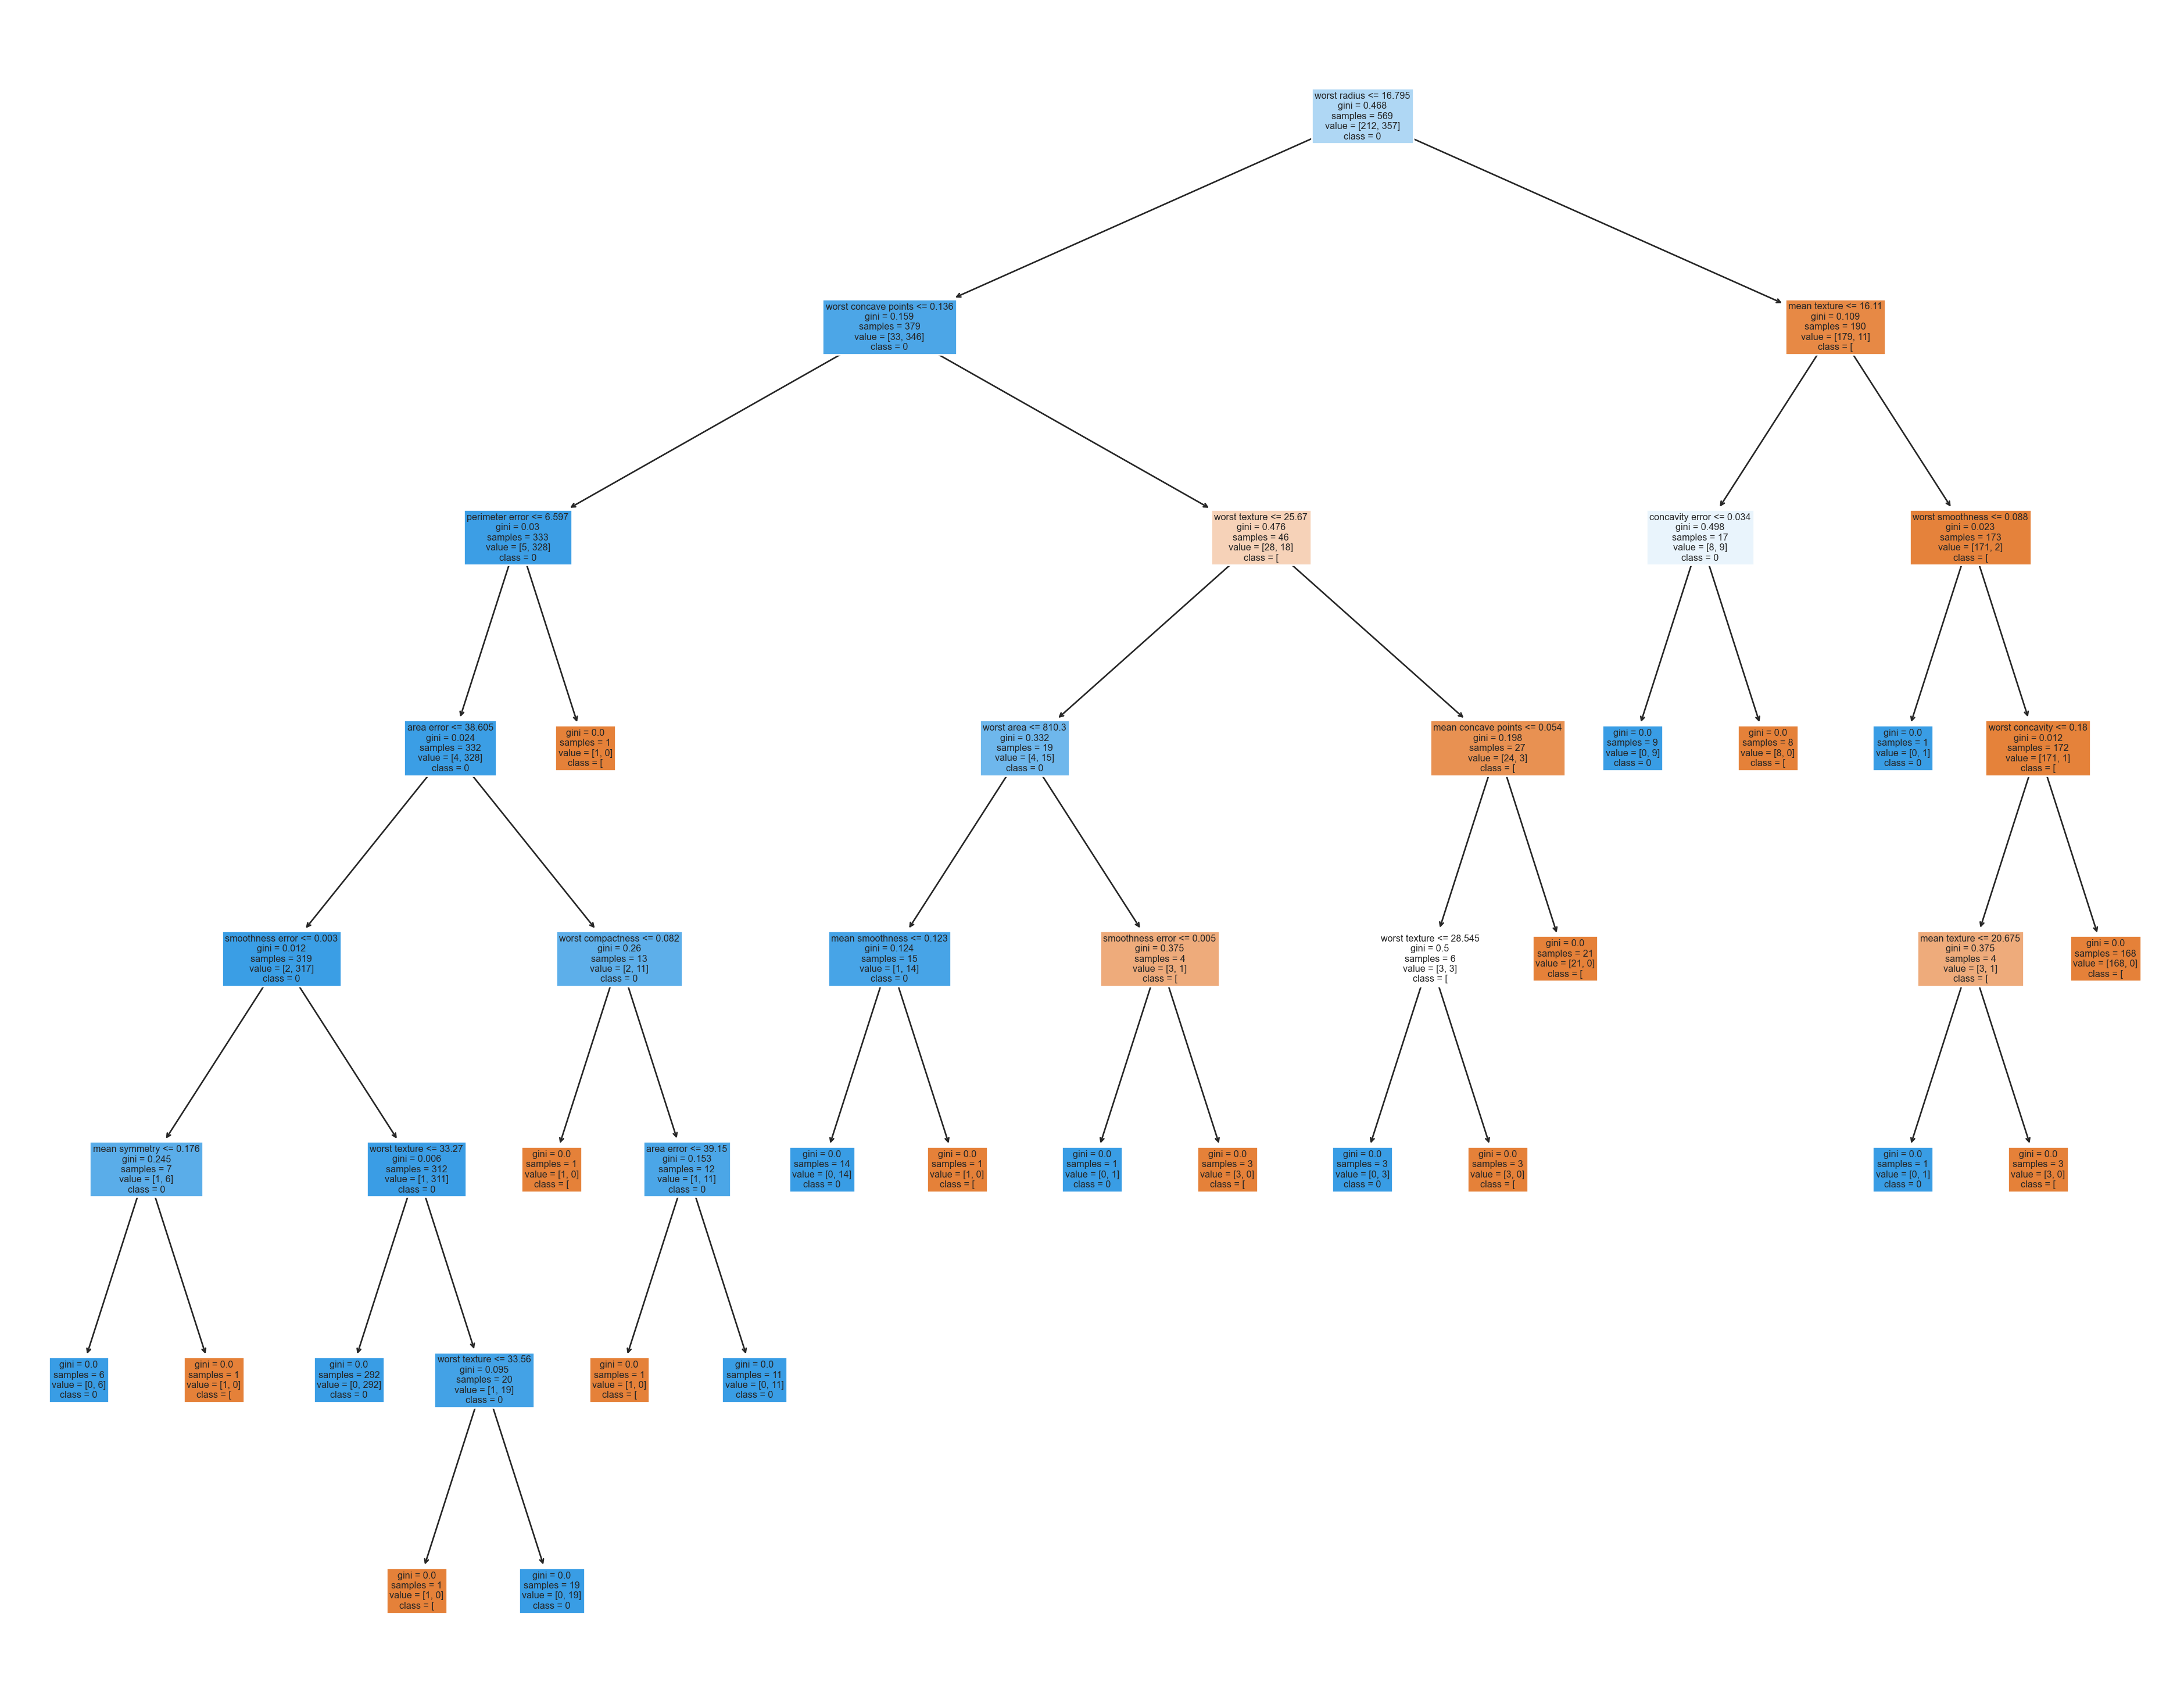
plot_tree(model,X,Y)------TRAINING------
------TEST------
